środa, 4 lipca 2018

Simple kriging playground.


Mój playground z Małopolską.


library(tidyverse) 
library(gstat)
library(sf)

# ---02. Przerabiam dane wysokościowe

dane_plik <- "dane/malopolskie.txt"

dane_nmt <- read_delim(dane_plik, " ", col_names = c("x", "y", "z"), col_types = "ddd") %>% 
  sample_n(size = 1000, replace=F) %>% 
  st_as_sf( coords = c("x", "y"), crs = 2180, agr = "constant", precision = 0.1) %>% 
  st_transform(crs = 4326) %>%
  as_Spatial(.)


#---03. Przerabiam shp na grid

woj_TERYT <- "12"
malopolska_shp <- st_read("dane/województwa.shp") %>% 
  st_transform(crs = 4326) %>%
  filter(jpt_kod_je==woj_TERYT) 


# grid
bbox<- st_bbox(malopolska_shp)

lon <- seq(bbox$xmin, bbox$xmax, length.out = 500)
lat <- seq(bbox$ymin, bbox$ymax, length.out = 500)
grd <- expand.grid(lon = lon, lat = lat) %>% 
  st_as_sf(coords = c("lon", "lat"), crs = 4326, agr = "constant") %>%   
  st_join(malopolska_shp, left=FALSE) %>%  
  as_Spatial(.)

malopolska_shp<-malopolska_shp %>% as_Spatial()


#---04. Variogram

#Jak w lm  z~(jakaś zmienna np stężenie w glebie ~ odległość od rzeki)


dt.vgm <- variogram(z~1,dane_nmt)

class(dt.vgm)

dt.fit <-
  fit.variogram(dt.vgm, model = vgm(1,"Lin",600,1)) # fit model

# vgm() list of models

plot(dt.vgm, dt.fit)


### 05. Kriging


lzn.kriged <- krige((z) ~ 1, dane_nmt , grd, model=dt.fit)

lzn.kriged %>% as.data.frame %>% rename(lon=coords.x1, lat=coords.x2) %>% 
  ggplot(aes(x=lon, y=lat)) + geom_tile(aes(fill=var1.pred)) + coord_equal() +
  scale_fill_gradient2(low="green", mid = "yellow",  high="red",midpoint = 0) +
  theme_bw()

wtorek, 12 września 2017

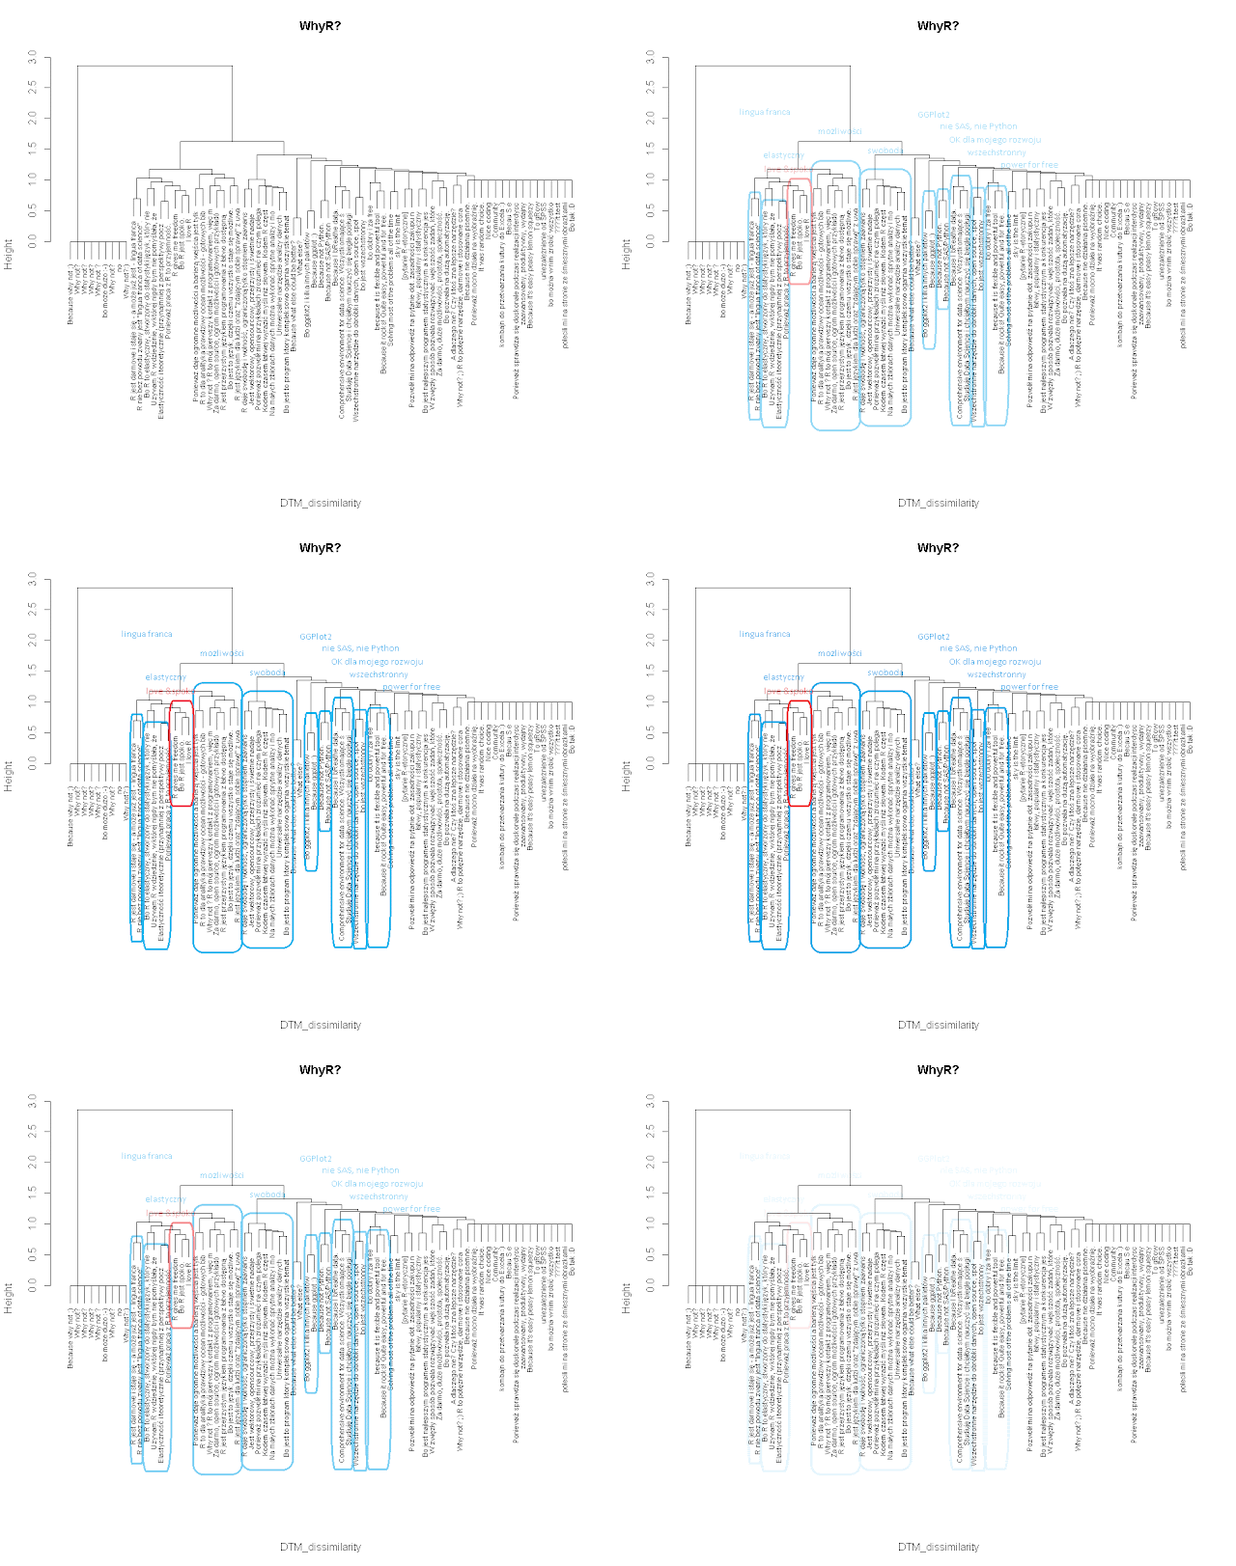
Dlaczego R? hclust

hclust - Próba analizy odpowiedzi w formularzu zapisów na konferencję WhyR. kolumna: "Chcesz.podzielić.się.odpowiedzią.na.to.pytanie..Chętnie.przedstawimy.najciekawsze.odpowiedzi"
- bo lingua franca,
- bo ogromne możliwości,
- bo ggplot2,
- bo nie Python, bo nie SAS,
- bo za free,
- bo Data Science...

Interpretacja subiektywna w Paincie :-)


R za darmo daje ogromne możliwości i pozwala się rozwijać i komunikować (lingua franca), szczególnie dzięki GGPlot2. Jest za darmo. Jest alternatywą dla  SASa i  Pythona.

Edycja w EzGif.com

piątek, 9 czerwca 2017

Introductory Python ML, short 2 day course.

Conclusions:
1. R is so much easier, portable, supercool. Jupyter Notebooks are far from Rstudio R Notebooks.
2. Python can be learned/is similar, just remember,  indenting is part of syntax :-)
3. I must learn Pandas! Scikit Learn! Seaborn! maybe by comparison to dplyr, ggplot2.

Microsoft, please allow more of R/ExcelVBA/Python interoperability for all.

Excel: Conditional formatting string numbers...

Why I have never discovered that until today!!!:

[=0]"";rrrr-mm-dd

"If there is 0, then do not put an erroneous date (a result of some bug in Excel insisting there is a 1900-01-00 date)". Is there more? Like coloring the font dependent on conditions met? Supercool!

sobota, 6 maja 2017

Big Data on a laptop, some options.

Data mining on streams.
http://moa.cms.waikato.ac.nz/rmoa-massive-online-data-stream-classifications-with-r-moa/
http://jwijffels.github.io/RMOA/
https://cran.r-project.org/web/packages/stream/stream.pdf

Database light backend.
https://www.monetdb.org/blog/monetdblite-r

Data mining
https://rdrr.io/cran/ffbase/man/bigglm.ffdf.html
https://cran.r-project.org/web/packages/speedglm/speedglm.pdf
https://cran.r-project.org/web/packages/randomForest.ddR/randomForest.ddR.pdf

piątek, 5 maja 2017

Bayes for beginners videos.

How to explain it plain E:
https://www.khanacademy.org/math/statistics-probability/probability-library/conditional-probability-independence/v/calculating-conditional-probability
http://www.watchknowlearn.org/Video.aspx?VideoID=16751&CategoryID=4457

https://www.khanacademy.org/math/ap-statistics/probability-ap/stats-conditional-probability/v/bayes-theorem-visualized
https://www.khanacademy.org/partner-content/wi-phi/wiphi-critical-thinking/wiphi-fundamentals/v/bayes-theorem
https://www.youtube.com/watch?v=Y-V4rfdl3NI
https://brilliant.org/wiki/bayes-theorem/

piątek, 24 marca 2017

Risk matrix in R (interesting readings)


1) Risk matrix examples http://davidmeza1.github.io/2015/12/17/2015-12-17-Creating-a-Risk-Matrix-in-R.html

2) Use ggrepel instead of jitter  https://cran.r-project.org/web/packages/ggrepel/vignettes/ggrepel.html
 for multiple points.

3)  Is there ggrepel for Excel (?) http://stackoverflow.com/questions/30294041/excel-bubble-chart-overlapping-data-label